Reshape data
pivot_longer() - pivot_wider to make a wide dataset long and vice-versa
The United Nations have all sorts of data. For this example, we will work with data on tourist/visitor arrivals and tourism expenditure. The dataframe un_tourism_data has been loaded into memory, and contains data on tourist arrivals (in thousands) and tourism expenditure (in millions of US$). We would like to calculate spending per tourist and see how some of the top tourist destinations compare
You have to:
- Convert
un_tourism_datafrom long to wide format; you need to do this to create the new variablespending_per_tourist - clean column names
- rename columns to “tourism_expenditure” and “tourist_arrivals”
- remove rows where tourism expenditure or arrivals are
NA - create a new column where you calculate spending per tourist (remember expenditure is in millions and arrival is in thousands)
You have successfully calculated spending per tourist. We are now faced with the challenge of producing a plot that looks like this
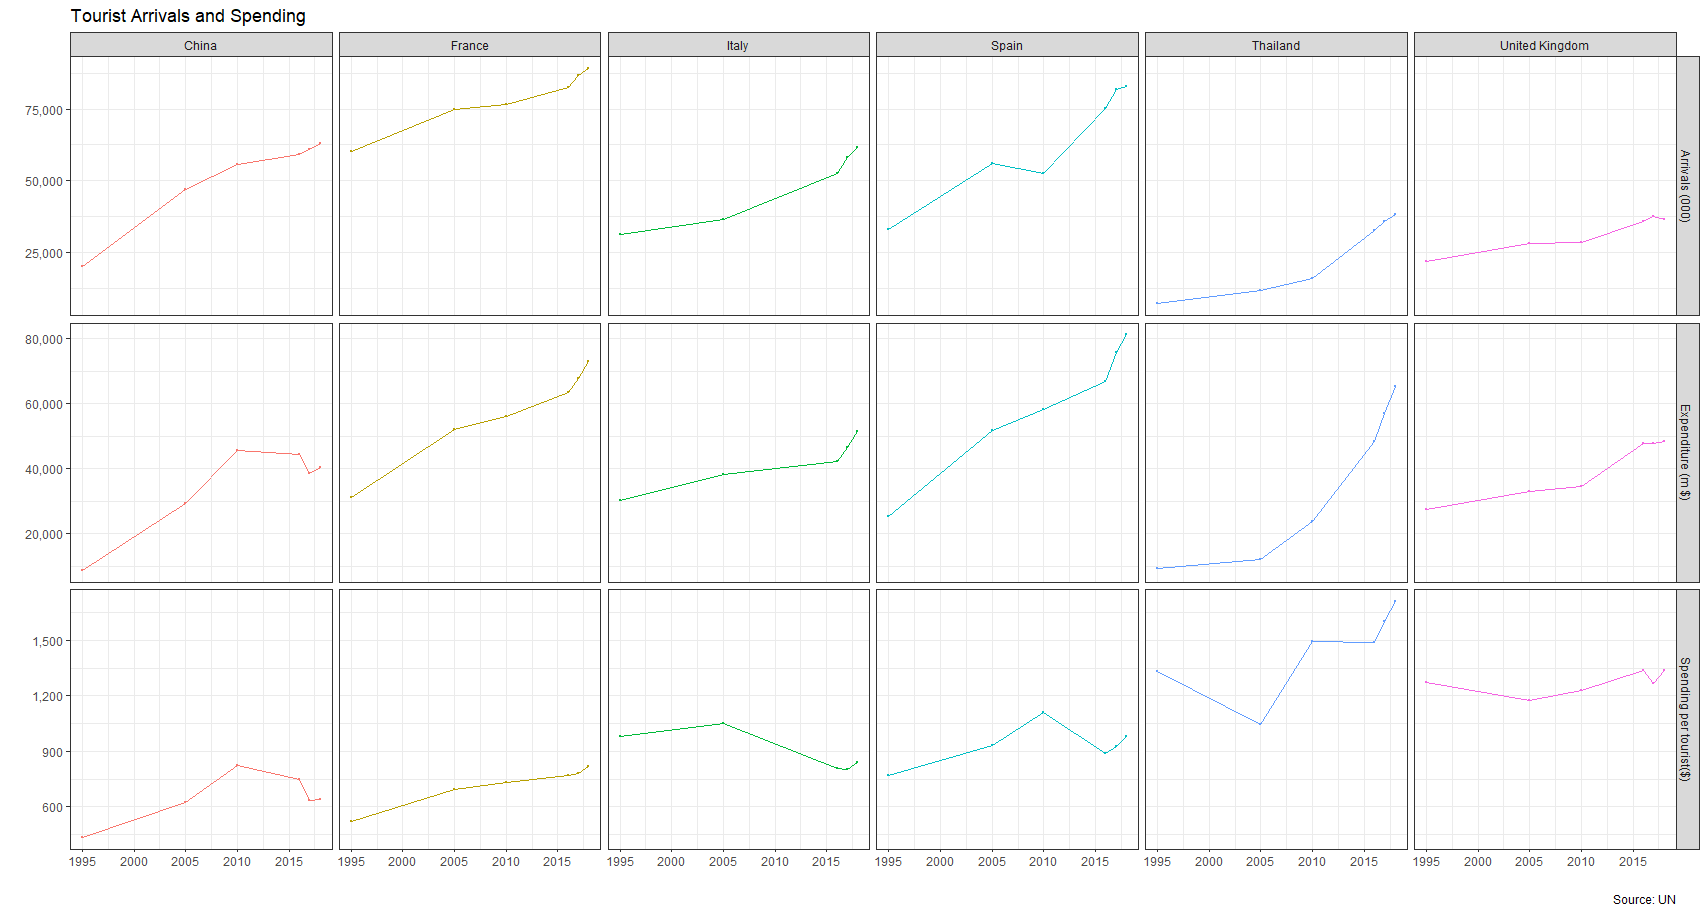
The best way to get this plot is to first reshape the dataframe from wide to long, and then apply your ggplot skills.
left_join() to join tables on columns
We have loaded into memory two dataframes countries and matches that contain matches played in various European football (soccer) leagues over a number of years. We want to join the two dataframes, so we can see the name, rather than an ID of the league. We also want to calculate the average number of goals per game in each league and plot those averages for all seasons.
bind_rows() to combine rows from two or more datasets
We have three distinct dataframes, england_matches, germany_matches, and italy_matches that contain data on each country. We need to combine these three datasets into one, and sort it in ascending order by date.