Manipulate data
- Select variables in a dataset using
select()and sort usingarrange() - Filter rows in a dataset using
filter() mutate()to change the data type of a variable and create new variablesgroup_by()/summarise()to get summary statistics, including counts, means, etc., within categories.- Putting it all together
Select variables in a dataset using select() and sort using arrange()
The dataframe movies has been loaded into memory. It contains a sample of movies from IMDB, and its contents are shown below:
Filter rows in a dataset using filter()
Remember that select() allows us to choose columns, or variables, whereas filter() chooses rows, or cases, that conform to certain criteria
mutate() to change the data type of a variable and create new variables
group_by()/summarise() to get summary statistics, including counts, means, etc., within categories.
Putting it all together
You can put together all of your dplyr knowledge to work four genres of movies, namely action, adventure, comedy and drama and create the following plot.
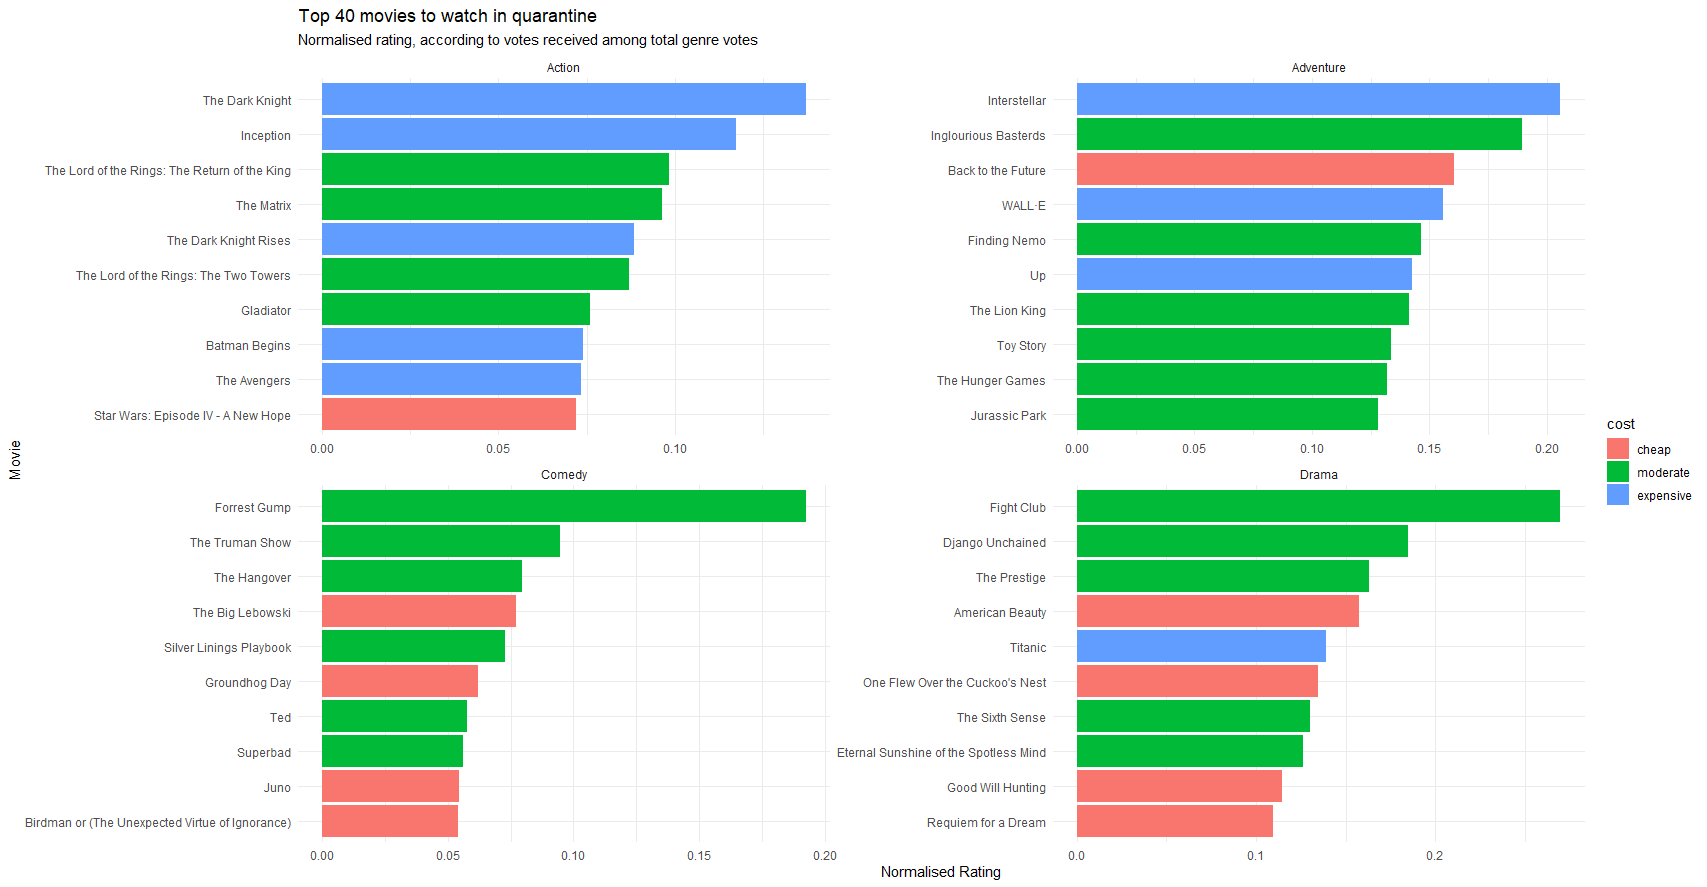
For these genres, you have to
- Make sure you do not have multiple entries of the same movie; use
distinct(movie, _keep.all=TRUE) - Calculate a normalised metric for rating, where you adjust the movie’s rating by the number of votes it received out of the total votes in its genre,
normalised_rating = rating * (votes / total votes in genre) - Arrange movies, so higher
normalised_ratingappears first. - Categorise and colour movies according to their budget
cost- cheap (<20m, or <
20e6ase6is R shorthand for 1 million, or \(10^6\), - moderate (20-120m), and
- expensive (>120m)
- cheap (<20m, or <
- Convert
costcolumn to a factor variable and re-level in the correct order (cheap, moderate, expensive) - Change the labels in the x- and y-axis, and give appropriate titles, subtitles, etc
- use theme minimal
Some tips:
- for sorting columns within a a ggplot, check out the
reorder()in x argument - if you perform dplyr on original dataframe make sure to overwrite dataframe otherwise all changes are done on the fly and are not saved
- consider freeing the scales of the facet wrap